글로벌 환자 위험 Stratification Market 규모 및 점유율 분석 - 성장 추세 및 예측 (2023 - 2030)
글로벌 환자 위험 Stratification 시장은 구성 요소 (소프트웨어 및 서비스)에 의해 세분화됩니다, 배달 모델 (전제 및 클라우드 기반)에 의해, 유형 (지정적 위험 Stratification 모델, 복도 위험 Stratification 모델, Prospect....
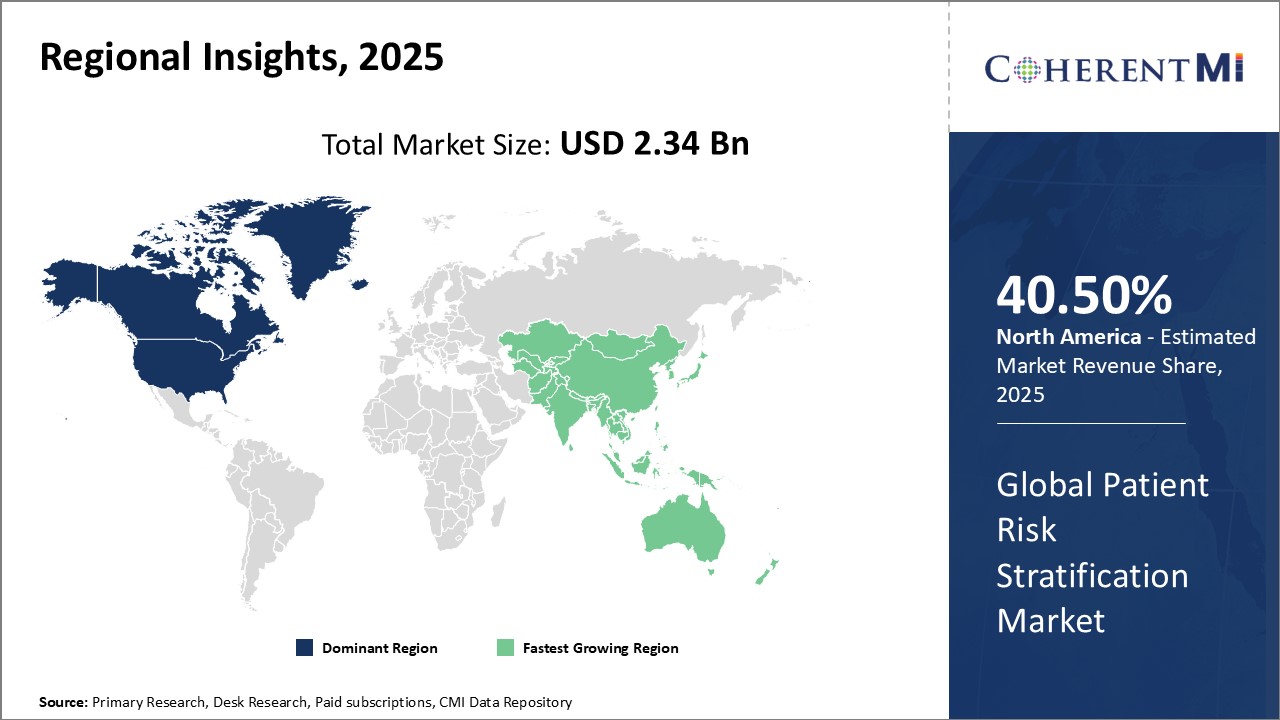
글로벌 환자 위험 Stratification Market 크기
USD 기준 시장 규모 Bn
CAGR22.2%
| 연구 기간 | 2023 - 2030 |
| 추정 기준 연도 | 2022 |
| CAGR | 22.2% |
| 가장 빠르게 성장하는 시장 | Asia Pacific |
| 대규모 시장 | North America |
| 시장 집중도 | High |
| 주요 플레이어 | 회사 소개, Epic 시스템, 팝업레이어 알림, Allscripts 의료 솔루션, Inc., IBM 회사 및 기타 |
저희에게 알려주세요!
글로벌 환자 위험 Stratification Market 분석
환자 위험 stratification 시장 크기는 도달 할 것으로 예상된다 US$ 11.44 Bn by 2030, 부터 US$ 1.56 Bn 에 2023, 에 CAGR 의 22.2% 예측 기간 중.
환자의 위험 stratification은 만성 질환에서 병원 읽거나 합병증과 같은 특정 결과를 개발하는 위험에 따라 식별 및 그룹화 환자의 과정입니다. 환자의 위험 만족 소프트웨어 및 서비스에 의해 가장 혜택을 받을 환자를 대상으로 하는 공급자를 허용합니다. 환자 위험의 주요 장점은 환자의 결과를 개선하고, 의료 비용을 절감하고, 더 나은 인구 건강 관리를 포함합니다.
시장 성장은 만성 질환의 상승률, 치료 비용 및 기술 발전의 필요성에 의해 구동된다. 환자 위험 stratification 시장은 구성 요소, 배달 모델, 유형, 응용 프로그램, 최종 사용자 및 지역에 따라 구분됩니다. 구성 요소로 시장은 소프트웨어 및 서비스로 구분됩니다. 예측 분석 및 데이터 통합 솔루션의 성장 채택에 가장 큰 공유를위한 소프트웨어 세그먼트 계정.
환자 위험 Stratification 시장 드라이버
- 만성 질병의 발전 : 당뇨병, 심혈관 질환, 만성 호흡기 질환 및 암과 같은 만성 질환의 발생률은 환자의 위험 증대 시장의 성장을 주도하는 주요 요인입니다. 만성 질환은 지속적인 건강 모니터링 및 관리가 필요한 장기간의 건강 상태입니다. Risk stratification는 공급자가 만성 질병 및 표적 예방 개입에서 합병증 개발의 높은 위험에 환자를 식별 할 수 있습니다. 예를 들어, 예측 분석은 병원 읽음의 높은 위험에 당뇨병 환자를 식별 할 수 있으므로 적절한 결과를 피하기 위해 관리 프로그램에 등록 할 수 있습니다. 만성 질환의 증가 된 부담은 질병 관리를 최적화하는 고급 위험 stratification에 대한 필요성을 만듭니다.
- 의료 비용을 줄이기 위해 필요: 의료비 상승, 급여 및 공급자는 비용 절감을 위한 혁신적인 방법을 찾고 있습니다. 환자의 위험 stratification은 높은 비용 환자를 식별하고 그들의 필요에 따라 배려 납품을 정렬하는 행동 가능한 통찰력을 제공합니다. 예를 들어, 동시 위험 모델은 높은 비용으로 환자를 식별 할 수 있으므로 관리 팀은 불필요한 활용 및 지출에 대한 불리한 이벤트를 방지 할 수 있습니다. Risk stratification는 피할 수 있는 의료비를 감소시키는 것을 목표로 하는 가치 근거한 인구 건강 모형을 가능하게 합니다. 예상치에 따르면, 위험 평가의 성공적인 구현은 한 달에 한 달에 $ 100에서 US $ 1,000의 비용 절감으로 발생할 수 있습니다.
- 호의적인 정부 이니셔티브: 정부 정책 및 이니셔티브 예방 관리, 가치 기반 재투자, 및 인구 건강 관리는 환자 위험 증폭 솔루션의 채택에 기여하고 있습니다. 예를 들어, CMS Medicare Shared Savings Program은 회계 관리 조직 (ACO)을 권장합니다. 또한, 위험 조정 프로그램은 계산된 지불을 위해 계획 구성원을 정확하게 stratify하는 급여를 요구합니다. 이러한 프로그램은 위험 증폭 시장의 성장을 위한 지속적인 환경을 조성하고 있습니다.
- 분석, 인공 지능 (AI) 및 기계 학습의 발전 : 예측 분석, 인공 지능, 기계 학습 및 큰 데이터 기술에 대한 전진은 현대 위험 stratification 솔루션의 기능을 강화하고 있습니다. 자연적인 언어 처리와 unsupervised 학습은 unstructured 임상 주에서 통찰력을 추출하고 위험 조건의 알 수없는 패턴 예측을 식별 할 수 있습니다. AI 기반 모델은 지속적으로 자체 떨어질 수 있으며 예측 정확도를 향상시킵니다. 종합적인 실제 데이터에 대한 액세스는 더 많은 과립 및 정확한 위험 stratification 알고리즘을 가능하게 합니다. 이러한 기술 향상은 크게 위험 stratification의 채택을 확장 할 것으로 예상됩니다.
환자 위험 Stratification 시장 기회
- 실제 증거 (RWE) 및 큰 데이터 활용: 임상 설정 및 보험 청구서의 실제 데이터는 환자 건강 결과, 치료 패턴, 자원 활용 및 비용으로 광범위한 통찰력을 제공합니다. 위험 모델의 RWE 및 큰 데이터 활용은 임상 위험과 위험에 대한 더 정확한 예측을 이끌 수 있습니다. 예를 들어, socioeconomic 및 genomic 데이터를 통합하면 건강 불안정의 사회적 세제에 대해 계정 할 수 있습니다. Big data analytics는 개별 환자 수준에서 개인화된 위험 평가를 할 수 있습니다. 전반적인 RWE와 큰 자료는 강화한 위험 stratification 기구를 개발하는 뜻깊은 기회를 선물합니다.
- 신흥 경제학의 환자 위험 만족 소프트웨어 채택: Emerging economies는 의료 인프라 개선, 중급 및 건강 보험 상승, 만성 질환의 발병률을 증가시키기 위해 성장하는 기회를 제공합니다. 개발 국가의 정부는 저렴한 의료 서비스에 대한 액세스를 강화하는 데 중점을두고 있습니다. 위험 stratification는 높은 위험 그룹 중 우선 자원 할당에 제공 할 수 있습니다. 인구의 건강 문제에 따라 지역화 위험 모델은 신흥 시장에서 채택하는 핵심이 될 것입니다.
- 건강의 사회적 세제의 법인 : 건강 (SDOH)의 사회 세제는 음식 접근, 주거 안정성, 수송 장벽 및 재정적인 독성과 같은 건강 위험의 피벗 예측자로 인식됩니다. 지역 사회 서비스 제공 업체의 SDOH 데이터를 통합하는 것은 더 나은 위험 stratification, 관리 조정 및 단점 인구 중 개선을 이끌 수 있습니다. 위험 조정 개입을 통해 SDOH 주소는 payers 및 회계 관리 조직에 대한 영향력있는 기회입니다.
- 환자 중심의 위험 예측 모델: Existing Risk Model은 임상적으로 의존하며 데이터 입력을 주장합니다. 환자를 위한 아웃소싱, 웨어러블 데이터 및 기타 실시간 데이터를 사용하여 환자 중심 모델 개발 예를 들어, 원격 환자 모니터링 및 환자 추적 데이터는 사무실 방문 사이에 실시간 가시성을 제공 할 수 있습니다. 이러한 과립상 데이터는 역동적인 위험 예측을 바탕으로 적시 개입을 허용할 수 있습니다. 위험 정보의 공유 결정에 대한 환자 참여는 또한 만족과 결과를 홍보합니다.
환자 위험 Stratification 시장 Restraints
- 데이터 개인 정보 보호 및 보안 문제: 환자 데이터의 큰 볼륨을 집계하는 데이터 개인 정보 보호 및 보안에 대한 우려는 시장 성장을 방해하고 있습니다. 제3자의 위험 모델링에 사용되는 민감한 건강 데이터의 개인 정보 보호에 대한 apprehensions가 있습니다. Cross-border 환자 데이터 전송을 관리하고 시장 확장을 억제합니다. 헬스케어 조직은 종종 보호된 건강 정보와 관련된 사이버 보안 위험 및 규정 준수 의무로 인해 위험 증대를 포괄하는 것이 중요합니다.
- 높은 상승 비용: 위험 stratification 소프트웨어, 인프라 및 리소스를 구현하는 고급 비용은 예산 제약을 가진 소규모 의료 기관에 적합합니다. Substantial 투자는 EHR (Electronic Health Record) 통합, 데이터 창고 설정, 분석 플랫폼 및 전문 고용에 필요한 것입니다. 복잡한 데이터 인프라 및 긴 ROI (투자 수익) 세터 많은 공급자. 그러나 SaaS(Software as a service) 기반 모델은 더 유연하고 저렴한 옵션을 제공합니다.
- 상호 운용성 문제: 효과적인 위험 stratification은 관리 설정에서 완전한 환자 데이터 집계에 의존합니다. 그러나, 납품업자 체계 및 파편한 자료 silos는 전체적인 상황에 도전을 가진 모이는 포괄적인 기록을 만듭니다. 다양한 EHR, 클레임 시스템, 레지스트리 및 기타 데이터 힌트 라이터 전체 위험 분석과 같은 상호 운용성 문제 발생. 표준화 된 용어 및 사양의 Lack 또한 hampers 데이터 통합.
글로벌 환자 위험 Stratification Market 트렌드
- 클라우드 기반 납품 모델: 클라우드 기반 위험 stratification 솔루션은 유연한 확장성, 신속한 배포 및 감소된 upfront 비용과 같은 이점을 얻기 위해 견인을 증가시킵니다. 클라우드는 다양한 시스템을 통해 쉽게 데이터 공유를 가능하게 하며 전체적인 위험 평가에 필요한 통합 환자 조회를 만들 수 있습니다. 클라우드 분석 및 기계 학습 리소스는 광범위한 현장 컴퓨팅 인프라 없이 복잡한 위험 알고리즘을 신속하게 실행할 수 있습니다. On-premise 데이터 보안과 함께 클라우드 민첩성을 혼합하는 하이브리드 모델. 전반적으로, 구름 납품 모형은 위험 stratification 시장에서 눈에 띄는 동향입니다.
- 건강 정보 교환 (HIE) 통합: 지역 보건 정보 교환 및 임상 데이터 저장소를 통한 위험 관리 솔루션 통합은 정확한 모델에 필요한 종합 환자 데이터 액세스가 가능합니다. HIEs는 병원, 의사 사무실, 실험실, 약국, payers 및 지리적 지역 내의 다른 entities와 같은 임상 데이터 공유를위한 허브 역할을합니다. 위험 stratification을 위한 종합적인 HIE 환자 기록에 그림은 더 정확한 위험 득점을 제공합니다. 헬스케어 조직은 점점 더 HIE와 임베디드 통합 할 수있는 위험 stratification 시스템을 배치하고 있습니다.
- 구급차 및 가정 근거한 위험 stratification: 위험 모델은 기존의 병 청구 데이터에 의존했습니다. 그러나, 임상 및 원격 디지털 데이터를 사용하여 구급차 및 홈 기반 위험 평가를 향한 이동이 있습니다. 1 차 진료 및 전문가 방문은 조기 개입을 통해 예방 가능한 병원 활용을 도울 수 있습니다. 유사하게, 원격으로 방문 사이 중요한 생명 및 건강 지시자를 감시하는 것은 이른 위험 탐지를 가능하게 할 수 있습니다. 병원 벽을 넘어 이러한 커뮤니티 중심의 위험 평가는 중요한 추세입니다.
- unstructured 자료를 위한 자연적인 언어 가공 (NLP): Unstructured 임상 노트는 위험 모델에 대한 귀중한 환자 정보를 포함합니다. NLP 및 연설 인식 기술은 의사 narratives, 방전 요약, 방사선 보고서 및 기타 narrative 문서의 통찰력을 잠금 해제하는 데 사용됩니다. NLP는 자동으로 임상 개념을 태그, 위험 요소 추출, 구조 데이터에 인코딩. 이것은 위험 알고리즘에 통합되지 않은 임상 데이터를 통합하여 광범위한 수동 차트 리뷰없이 더 정확하게 만듭니다.
그림 . 글로벌 환자 위험 Stratification Market Share (%), 지역, 2023
경쟁 개요 글로벌 환자 위험 Stratification Market
환자 위험 평가 시장에서 운영되는 주요 플레이어 중 일부는 Cerner Corporation, Epic Systems Corporation, Optum, Inc., Allscripts Healthcare Solutions, Inc., IBM Corporation, Medecision, Inc., Health Catalyst, Inc., Conifer Health Solutions, LLC, Wellcentive, Inc., ZeOmega, Inc., Verscend Technologies, Inc., AccuraDx, CitiusTech Inc., Avero Diagnostics, Lightam, Inc., Verscend Technologies, Inc., Verscend Technologies, Inc., Verscend Technologies, Inc., Verscend Technologies, CitiusTech Inc., Avero Diagnostics, Lightam, Inc., N., Inc., Inc., Inc., Inc.에서 운영합니다.
글로벌 환자 위험 Stratification Market 선두
- 회사 소개
- Epic 시스템
- 팝업레이어 알림
- Allscripts 의료 솔루션, Inc.
- IBM 회사
글로벌 환자 위험 Stratification Market - 경쟁 경쟁

글로벌 환자 위험 Stratification Market
(주요 플레이어가 지배)
(많은 플레이어가 있는 매우 경쟁적)
최근 개발 글로벌 환자 위험 Stratification Market
핵심전략
- 에서 2월 2023, Avero 진단전문 암 진단 회사 인 AMBLor Test를 시작으로 초기 단계의 melanoma의 위험 강화를 가능하게했습니다.
- 에 1월 2022, 정밀 DX, 암 위험 stratification 회사, 시리즈에서 US $ 10.7 백만의 상승 발표 2021 AI 전원 위험 분류 플랫폼의 지속적인 개발 및 상용화 지원
채용 정보
- 지난 10월 2022일, GE Healthcare, 글로벌 헬스케어 회사, AMC Health, 의료 기술 회사인 GE Healthcare는 분석 및 위험 평가를 적용하는 확장 가능한 원격 환자 모니터링 (RPM) 솔루션에 대한 시장 요구 사항을 충족하기 위해 협력을 발표했습니다. 향후 서비스에 대한 예상된 환자 수요를 식별하기 위해 분석 및 위험 평가를 적용 할 수 있습니다.
글로벌 환자 위험 Stratification Market 세분화
- 제품정보
- 소프트웨어
- 제품정보
- 납품 모형에
- 회사 소개
- 클라우드 기반
- 이름 *
- 예측 위험 Stratification 모델 번호:
- 복리후생 위험 모델 번호:
- 예측 위험 Stratification 모델 번호:
- 동시 위험 Stratification 모델 번호:
- 회사연혁
- 인구 건강 관리
- 위험 조정
- Revenue 사이클 관리
- 임상 연구
- 최종 사용자
- 의료기관
- 의료용 Payers
- 다른 최종 사용자
- 지역별
- 북아메리카
- 라틴 아메리카
- 유럽 연합 (EU)
- 아시아 태평양
- 중동
- 주요 특징

구매 옵션을 알아보시겠어요?이 보고서의 개별 섹션?
자주 묻는 질문 :
환자의 위험 증대 시장의 성장에 대한 주요 요인은 무엇입니까?
데이터 개인 정보 보호 및 보안 문제, 높은 업 프론트 비용 및 상호 운용성 문제는 환자의 위험 stratification 시장의 성장을 방해하는 몇 가지 핵심 요소입니다.
환자의 위험 stratification 시장 성장을 운전하는 주요 요인은 무엇입니까?
만성 질환의 상승률, 의료비 절감, 큰 데이터 분석 및 AI의 발전, 유리한 정부 정책, 환자의 위험 stratification 시장의 성장을 주도하는 주요 요인입니다.
환자 위험 stratification 시장에 있는 주요한 성분 세그먼트는 무엇입니까?
환자 위험 평가 시장의 주요 구성 요소 세그먼트는 예측 분석, EHR 통합 및 데이터 집계 솔루션의 상승 채택으로 인한 소프트웨어 세그먼트입니다.
환자의 위험 증대 시장에서 작동하는 주요 선수는 무엇입니까?
환자 위험 평가 시장에서 운영되는 주요 플레이어 중 일부는 Cerner Corporation, Epic Systems Corporation, Optum, Inc., Allscripts Healthcare Solutions, Inc., IBM Corporation, Medecision, Inc., Health Catalyst, Inc., Conifer Health Solutions, LLC, Wellcentive, Inc., ZeOmega, Inc., Verscend Technologies, Inc., AccuraDx, CitiusTech Inc., Avero Diagnostics, Lightam, Inc., Verscend Technologies, Inc., Verscend Technologies, Inc., Verscend Technologies, Inc., Verscend Technologies, CitiusTech Inc., Avero Diagnostics, Lightam, Inc., N., Inc., Inc., Inc., Inc.에서 운영합니다.
어떤 지역은 환자의 위험 stratification 시장을 이끌 것인가?
북미는 예측 기간 동안 시장 점유율 측면에서 환자의 위험 예측 시장을 선도 할 것으로 예상됩니다.
환자 위험 평가 시장의 CAGR는 무엇입니까?
환자 위험 평가 시장의 CAGR은 2023에서 2030로 22.2%로 추정됩니다.