全球患者风险分级市场 规模与份额分析 - 成长趋势与预测 (2023 - 2030)

全球患者风险分级市场按构成部分(软件和服务)、分级交付模式(基于成份和云),按类型(风险分级预测模式、风险分级预测模式、风险分级预测模式、风险分级预测模式和同时期风险分级模型)、按应用(人口健康管理、风险调整、收入周期管理和临床工作流量),按最终用户(保健提供者、保健付费人和其他最终用户),按区域(....

全球患者风险分级市场 规模

市场规模(美元) Bn

复合年增长率22.2%

研究期2023 - 2030
估计基准年2022
复合年增长率22.2%
增长最快的市场Asia Pacific
最大的市场North America
市场集中度High
主要参与者瑟纳公司, Epic系统公司, 奥普图姆股份有限公司., 保健解决方案公司, IBM公司 以及其他
*免责声明:主要参与者的列表没有特定的顺序。
*来源:Coherent Market Insights
setting-icon
想要购买定制报告吗?
请告诉我们!

全球患者风险分级市场 分析

患者的风险分层市场规模预计将达到 到2030年11.44 Bn,从2023年的1.56 Bn,在22.2%的CAGR中 在预测期间。

患者风险分层是根据其出现某些结果(如医院重新接纳或慢性疾病并发症)的风险进行识别和分组的过程。 它使供应商能够把干预目标对准那些通过病人风险满意度软件和服务受益最多的病人。 患者风险分层的主要优点包括:患者结果得到改善,医疗保健费用降低,人口健康管理得到改善。

市场增长的动力是老年人口的增加、慢性病的日益流行、控制保健费用的需要和技术进步。 患者风险分级市场按组件,投递模式,类型,应用,最终用户,区域划分. 按构成部分划分,市场分为软件和服务。 软件部分所占份额最大,原因是越来越多地采用预测分析法和数据整合办法进行风险分层。

患者风险分级 市场驱动器

  • 慢性疾病的发病率不断上升: 糖尿病、心血管疾病、慢性呼吸道疾病和癌症等慢性疾病的发病率上升,是推动患者风险分层市场增长的主要因素。 慢性病是长期的健康条件,需要持续的健康监测和护理管理. 风险分层使提供方能够确定有发生慢性疾病并发症的高风险患者,并相应地确定预防干预措施的目标。 例如,预测分析可以确定有重新住院风险的糖尿病患者,以便他们能够参加护理管理方案,避免不良结果。 慢性病的负担日益加重,因此需要先进的风险分层来优化疾病管理。
  • 需要降低保健费用: 随着医疗保健费用的增加,付款人和提供者正在寻找创新方法,在降低成本的同时改善成果。 患者风险分层提供可操作的洞察力,以识别高成本患者,并使护理的提供符合他们的需要。 例如,同时存在的风险模型可以确定可能付出高昂费用的病人,因此护理小组可以防止导致不必要的利用和开支的不良事件。 风险分层使基于价值的人口健康模式能够降低可避免的保健费用。 据估计,成功实施风险分层可节省风险人群每月每个成员100至1,000美元的费用。
  • 有利的政府倡议: 政府促进预防护理、基于价值的补偿和人口健康管理的政策和举措有助于采用患者风险分层解决方案。 例如,CMS医疗保险共享储蓄方案鼓励负责任的护理组织利用风险分层提供高效和协调的护理。 此外,风险调整方案要求付款人准确划分计划成员人均付款。 这些方案正在为风险分层市场的增长创造有利环境。
  • 分析、人工智能和机器学习方面的进步: 预测分析、人工智能、机器学习和大数据技术的不断进步正在增强现代风险分层解决方案的能力。 自然语言处理和无监督的学习可以从无结构的临床笔记中提取洞察力,并找出风险条件的未知规律预测. 基于AI的模型可以不断自我学习,并提高其预测准确性. 获取全面的现实世界数据可以使风险分层算法更加颗粒化和精确。 预计这种技术的改进将大大扩大今后风险分级的采用。

患者风险分级 市场机会

  • 利用现实世界证据(RWE)和大数据: 来自临床环境和保险索赔的真实世界数据使人们广泛了解病人的健康结果、治疗模式、资源利用和费用。 在风险模型中利用RWE和大数据可以导致对临床风险和轨迹的更准确的预测. 例如,整合社会经济和基因组数据可以说明健康不平等的社会决定因素。 大数据分析还可以推动个人患者层面的个性化风险评估. 总体而言,可再生能源和大数据为制定强化的风险分层框架提供了重要机会。
  • 新兴经济体采用患者风险满意度软件: 新兴经济体由于改善保健基础设施、增加中产阶级和健康保险以及增加慢性疾病的发病率,提供了未开发的增长机会。 发展中国家政府的重点是增加获得负担得起的保健服务的机会。 风险分层可以帮助提供者在高风险低收入群体中优先分配资源。 将风险模型按人口健康挑战本地化将是新兴市场采用的关键。
  • 纳入健康的社会决定因素: 健康的社会决定因素,如获得食物、住房稳定、交通障碍和金融毒性,被公认为健康风险的关键预测因素。 纳入社区服务提供者的性别歧视数据,可改善弱势群体的风险分层、护理协调和结果改善。 通过风险调整干预措施解决性别歧视问题,是付款人和负责的护理组织的一个具有影响力的机会。
  • 以病人为中心的风险预测模型: 现有风险模型主要依靠临床和索赔数据投入。 利用病人报告的结果、可穿戴数据和其他现实世界数据开发以病人为中心的模型,可以进行更个性化的风险评估。 例如,远程病人监测和病人报告的数据可以实时显示办公室访问之间的健康变化。 这种颗粒性数据能够根据动态风险预测及时进行干预。 患者参与风险信息方面的共同决策,也有助于满足和结果。

患者风险分级 市场限制

  • 数据隐私和安全问题: 与大量病人数据聚合有关的数据隐私和安全性问题正在阻碍市场增长。 人们担心第三方用于风险模型的敏感健康数据的隐私。 有关跨界病人数据传输的严格条例也制约了市场的扩张。 由于网络安全风险和与受保护的健康信息有关的遵守义务,保健组织往往不愿接受风险分层。
  • 高额预付费用: 实施风险分层软件、基础设施和资源的高昂前期成本具有挑战性,特别是对预算有限的小型保健组织而言。 需要为EHR(电子健康记录)集成、数据仓设置、分析平台和专家聘用进行大量投资。 复杂的数据基础设施和长期ROI(恢复投资)使许多提供者感到震慑。 然而,基于SaaS(软件作为一种服务)的模型正在出现,以提供更加灵活和负担得起的选择。
  • 互操作性问题: 有效的风险分级取决于各个护理环境的完整的病人数据汇总。 然而,不同的供应商系统和零散的数据仓使综合记录的收集工作充满挑战。 各种电子人力资源、索赔系统、登记册和其他数据来源之间的基本互操作性问题阻碍了全面的风险分析。 缺乏标准化术语和规格也阻碍了数据整合。

全球患者风险分级市场 趋势

  • 基于云的交付模式: 由于灵活的可扩展性、快速部署和降低前期成本等好处,基于云的风险分层解决方案的吸引力越来越大。 云使不同系统之间易于分享数据,从而形成整体风险评估所需的综合病人意见。 云分析学和机器学习资源可以在没有广泛的现场计算基础设施的情况下快速运行复杂的风险算法. 混合模型将云的敏捷性与精准数据安全混合在一起正在出现。 总体而言,云送模式是风险分层市场的突出趋势.
  • 卫生信息交流一体化: 将风险分层解决方案与区域卫生信息交流和临床数据储存库相结合,使患者能够全面获取准确模型所需的数据。 卫生倡议是医院、医生办公室、实验室、药店、付款人和地理区域内其他实体之间综合临床数据共享的中心。 利用HIE综合患者记录进行风险分层,可以提供更精确的风险评分. 因此,各保健组织正日益寻求部署能够与健康影响评估嵌入式整合的风险分层系统。
  • 救护车和家庭风险分级: 风险模型通常依赖医院索赔数据。 然而,正在转向利用临床和远程数字数据进行流动和居家风险评估。 通过早期干预,分析初级保健和专家探访有助于防止可避免的医院使用。 同样,远程监测关键生命体征和两次访问之间的健康指标可以及早发现风险。 这种以社区为重点的、超越医院围墙的风险评估是一项重要趋势。
  • 非结构化数据的自然语言处理(NLP): 无结构的临床笔记中包含了风险模型中宝贵的患者信息. 正在使用NLP和语音识别技术从医生的叙述、出院摘要、放射学报告和其他叙述文件中解开洞察力。 NLP可以自动标记临床概念,提取风险因素,并编码为结构化数据. 这使得在风险算法中加入了无结构的临床数据,使其在不进行大量人工图表审查的情况下更加精确.

图. 全球患者风险分级市场份额(%),按区域分列,2023年
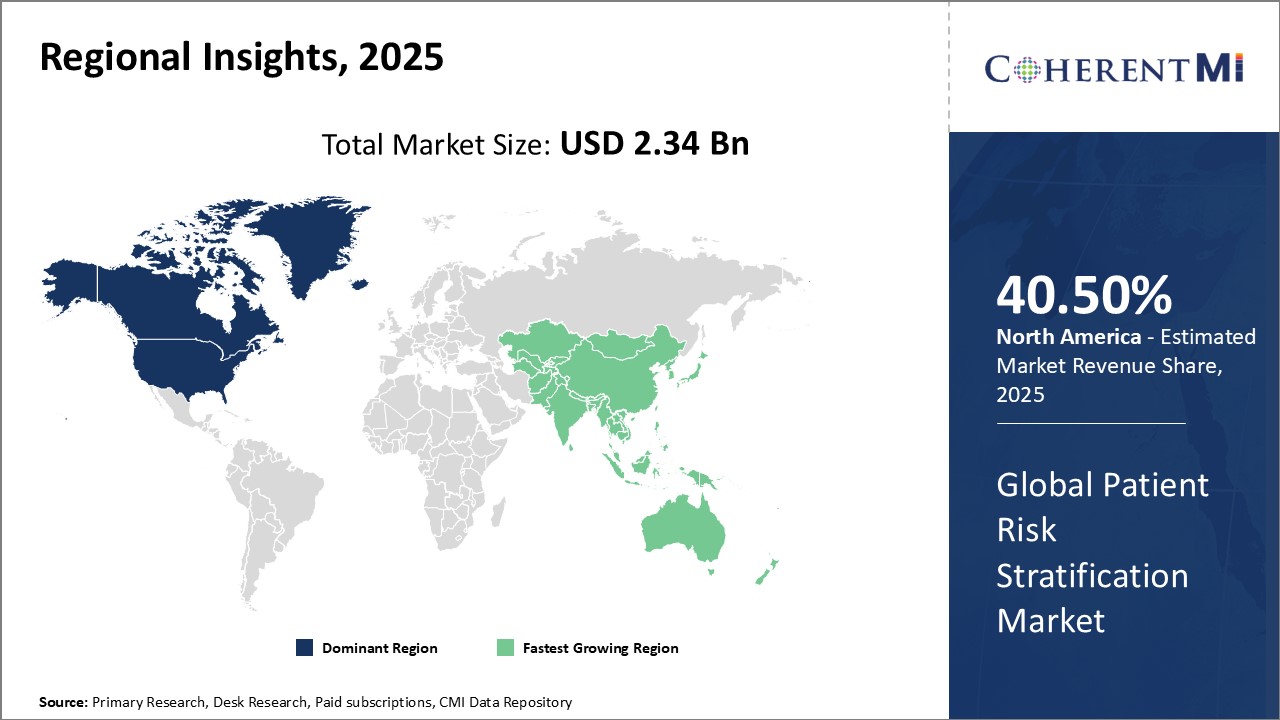
全球患者风险分级市场

竞争概览 全球患者风险分级市场

在患者风险分层市场运营的一些主要角色有:Cerner Corporation, Epic Systems Corporation, Optum, Inc., Allscripts Health Solutions, Inc., IBM Corporation, MeDecision, Inc., 健康催化剂公司, Conifer Health Solution, LLC, Wellcentive, Inc., ZeOmega, Verscend Technologies, Inc., PreciseDx, CitiusTech Inc., Avero诊断, Lightbeam Health Soluties, LexisNexis 风险解决方案,Milliman, Inc., Nvision Heality, RLDatix, 和Verisk Alytics, Inc.

全球患者风险分级市场 领导者

  • 瑟纳公司
  • Epic系统公司
  • 奥普图姆股份有限公司.
  • 保健解决方案公司
  • IBM公司
*免责声明:主要参与者的列表没有特定的顺序。

全球患者风险分级市场 - 竞争对手

Market Concentration Graph

全球患者风险分级市场

市场整合
(主要参与者主导)
市场分散
(竞争激烈,参与者众多。)
*来源:Coherent Market Insights

最新发展 全球患者风险分级市场

主要战略举措

  • 2023年2月,任,县知县. 阿韦罗诊断作为一家专门的癌症诊断公司,启动了AMBLor测试,在早期黑色素瘤中进行风险分层
  • 2022年1月,任,. 精确度Dx一个癌症风险分层公司,宣布在2021年增加1 070万美元的A系列优先投资,以支持其AI驱动的风险分类平台的不断发展和商业化

协作

  • 2022年10月,全球保健公司GE保健公司和保健技术公司AMC保健公司宣布合作,以满足市场需求,采用可扩展的远程病人监测(RPM)解决方案,采用分析法和风险分级法,确定预期病人对未来服务的需求,其中可包括入院或重新入院。

全球患者风险分级市场 报告 - 目录

Table of Contents

  1. Research Objectives and Assumptions
    • Research Objectives
    • Assumptions
    • Abbreviations
  2. Market Purview
    • Report Description
      • Market Definition and Scope
    • Executive Summary
      • Patient Risk Stratification Market, By Component
      • Patient Risk Stratification Market, By Delivery Model
      • Patient Risk Stratification Market, By Type
      • Patient Risk Stratification Market, By Application
      • Patient Risk Stratification Market, By End User
      • Patient Risk Stratification Market, By Region
    • Coherent Opportunity Map (COM)
  3. Market Dynamics, Regulations, and Trends Analysis
    • Market Dynamics
      • Growing prevalence of chronic diseases
      • Data privacy and security concerns
      • Leveraging real-world evidence (RWE) and big data
    • Impact Analysis
    • Key Highlights
    • Regulatory Scenario
    • Product Launches/Approvals
    • PEST Analysis
    • PORTER’s Analysis
    • Merger and Acquisition Scenario
  4. Patient Risk Stratification Market - Impact of Coronavirus (COVID-19) Pandemic
    • COVID-19 Epidemiology
    • Supply Side and Demand Side Analysis
    • Economic Impact
  5. Patient Risk Stratification Market, By Component, 2018-2030, (US$ Bn)
    • Introduction
      • Market Share Analysis, 2023 and 2030 (%)
      • Y-o-Y Growth Analysis, 2019 - 2030
      • Segment Trends
    • Software
      • Introduction
      • Market Size and Forecast, and Y-o-Y Growth, 2018-2030,(US$ Bn)
    • Services
      • Introduction
      • Market Size and Forecast, and Y-o-Y Growth, 2018-2030,(US$ Bn)
  6. Patient Risk Stratification Market, By Delivery Model, 2018-2030, (US$ Bn)
    • Introduction
      • Market Share Analysis, 2023 and 2030 (%)
      • Y-o-Y Growth Analysis, 2019 - 2030
      • Segment Trends
    • On-premise
      • Introduction
      • Market Size and Forecast, and Y-o-Y Growth, 2018-2030,(US$ Billion)
    • Cloud-based
      • Introduction
      • Market Size and Forecast, and Y-o-Y Growth, 2018-2030,(US$ Billion)
  7. Patient Risk Stratification Market, By Type, 2018-2030, (US$ Bn)
    • Introduction
      • Market Share Analysis, 2023 and 2030 (%)
      • Y-o-Y Growth Analysis, 2019 - 2030
      • Segment Trends
    • Predictive Risk Stratification Model
      • Introduction
      • Market Size and Forecast, and Y-o-Y Growth, 2018-2030,(US$ Billion)
    • Retrospective Risk Stratification Model
      • Introduction
      • Market Size and Forecast, and Y-o-Y Growth, 2018-2030,(US$ Billion)
    • Prospective Risk Stratification Model
      • Introduction
      • Market Size and Forecast, and Y-o-Y Growth, 2018-2030,(US$ Billion)
    • Concurrent Risk Stratification Model
      • Introduction
      • Market Size and Forecast, and Y-o-Y Growth, 2018-2030,(US$ Billion)
  8. Patient Risk Stratification Market, By Application, 2018-2030, (US$ Bn)
    • Introduction
      • Market Share Analysis, 2023 and 2030 (%)
      • Y-o-Y Growth Analysis, 2019 - 2030
      • Segment Trends
    • Population Health Management
      • Introduction
      • Market Size and Forecast, and Y-o-Y Growth, 2018-2030,(US$ Billion)
    • Risk Adjustment
      • Introduction
      • Market Size and Forecast, and Y-o-Y Growth, 2018-2030,(US$ Billion)
    • Revenue Cycle Management
      • Introduction
      • Market Size and Forecast, and Y-o-Y Growth, 2018-2030,(US$ Billion)
    • Clinical Workflow
      • Introduction
      • Market Size and Forecast, and Y-o-Y Growth, 2018-2030,(US$ Billion)
  9. Patient Risk Stratification Market, By End User, 2018-2030, (US$ Bn)
    • Introduction
      • Market Share Analysis, 2023 and 2030 (%)
      • Y-o-Y Growth Analysis, 2019 - 2030
      • Segment Trends
    • Healthcare Providers
      • Introduction
      • Market Size and Forecast, and Y-o-Y Growth, 2018-2030,(US$ Billion)
    • Healthcare Payers
      • Introduction
      • Market Size and Forecast, and Y-o-Y Growth, 2018-2030,(US$ Billion)
    • Other End Users
      • Introduction
      • Market Size and Forecast, and Y-o-Y Growth, 2018-2030,(US$ Billion)
  10. Patient Risk Stratification Market, By Region, 2018-2030, (US$ Bn)
    • Introduction
      • Market Share Analysis, By Region, 2023 and 2030 (%)
      • Y-o-Y Growth Analysis, For Region, 2019 - 2030
      • Country Trends
    • North America
      • Introduction
      • Market Size and Forecast, and Y-o-Y Growth, By Component, 2023-2030,(US$ Bn)
      • Market Size and Forecast, and Y-o-Y Growth, By Delivery Model, 2023-2030,(US$ Bn)
      • Market Size and Forecast, and Y-o-Y Growth, By Type, 2023-2030,(US$ Bn)
      • Market Size and Forecast, and Y-o-Y Growth, By Application, 2023-2030,(US$ Bn)
      • Market Size and Forecast, and Y-o-Y Growth, By Country, 2018-2030, (US$ Bn)
        • U.S.
        • Canada
    • Europe
      • Introduction
      • Market Size and Forecast, and Y-o-Y Growth, By Component, 2023-2030,(US$ Bn)
      • Market Size and Forecast, and Y-o-Y Growth, By Delivery Model, 2023-2030,(US$ Bn)
      • Market Size and Forecast, and Y-o-Y Growth, By Type, 2023-2030,(US$ Bn)
      • Market Size and Forecast, and Y-o-Y Growth, By Application, 2023-2030,(US$ Bn)
      • Market Size and Forecast, and Y-o-Y Growth, By Country, 2018-2030, (US$ Bn)
        • U.K.
        • Germany
        • Italy
        • France
        • Spain
        • Russia
        • Rest of Europe
    • Asia Pacific
      • Introduction
      • Market Size and Forecast, and Y-o-Y Growth, By Component, 2023-2030,(US$ Bn)
      • Market Size and Forecast, and Y-o-Y Growth, By Delivery Model, 2023-2030,(US$ Bn)
      • Market Size and Forecast, and Y-o-Y Growth, By Type, 2023-2030,(US$ Bn)
      • Market Size and Forecast, and Y-o-Y Growth, By Application, 2023-2030,(US$ Bn)
      • Market Size and Forecast, and Y-o-Y Growth, By Country, 2018-2030, (US$ Bn)
        • China
        • India
        • Japan
        • ASEAN
        • Australia
        • South Korea
        • Rest of Asia Pacific
    • Latin America
      • Introduction
      • Market Size and Forecast, and Y-o-Y Growth, By Component, 2023-2030,(US$ Bn)
      • Market Size and Forecast, and Y-o-Y Growth, By Delivery Model, 2023-2030,(US$ Bn)
      • Market Size and Forecast, and Y-o-Y Growth, By Type, 2023-2030,(US$ Bn)
      • Market Size and Forecast, and Y-o-Y Growth, By Application, 2023-2030,(US$ Bn)
      • Market Size and Forecast, and Y-o-Y Growth, By Country, 2018-2030, (US$ Bn)
        • Brazil
        • Mexico
        • Argentina
        • Rest of Latin America
    • Middle East
      • Market Size and Forecast, and Y-o-Y Growth, By Component, 2023-2030,(US$ Bn)
      • Market Size and Forecast, and Y-o-Y Growth, By Delivery Model, 2023-2030,(US$ Bn)
      • Market Size and Forecast, and Y-o-Y Growth, By Type, 2023-2030,(US$ Bn)
      • Market Size and Forecast, and Y-o-Y Growth, By Application, 2023-2030,(US$ Bn)
      • Market Size and Forecast, and Y-o-Y Growth, By Country, 2018-2030, (US$ Bn)
        • GCC
        • Israel
        • Rest of Middle East
    • Africa
      • Market Size and Forecast, and Y-o-Y Growth, By Component, 2023-2030,(US$ Bn)
      • Market Size and Forecast, and Y-o-Y Growth, By Delivery Model, 2023-2030,(US$ Bn)
      • Market Size and Forecast, and Y-o-Y Growth, By Type, 2023-2030,(US$ Bn)
      • Market Size and Forecast, and Y-o-Y Growth, By Application, 2023-2030,(US$ Bn)
      • Market Size and Forecast, and Y-o-Y Growth, By Country/Region, 2018-2030, (US$ Bn)
        • North Africa
        • Central Africa
        • South Africa
  11. Competitive Landscape
    • Cerner Corporation
      • Company Highlights
      • Product Portfolio
      • Key Developments
      • Financial Performance
      • Strategies
    • Epic Systems Corporation
      • Company Highlights
      • Product Portfolio
      • Key Highlights
      • Financial Performance
      • Strategies
    • Optum, Inc.
      • Company Highlights
      • Product Portfolio
      • Key Highlights
      • Financial Performance
      • Strategies
    • Allscripts Healthcare Solutions, Inc.
      • Company Highlights
      • Product Portfolio
      • Key Highlights
      • Financial Performance
      • Strategies
    • IBM Corporation
      • Company Highlights
      • Product Portfolio
      • Key Highlights
      • Financial Performance
      • Strategies
    • Medecision, Inc.
      • Company Highlights
      • Product Portfolio
      • Key Highlights
      • Financial Performance
      • Strategies
    • Health Catalyst, Inc.
      • Company Highlights
      • Product Portfolio
      • Key Highlights
      • Financial Performance
      • Strategies
    • Conifer Health Solutions, LLC
      • Company Highlights
      • Product Portfolio
      • Key Highlights
      • Financial Performance
      • Strategies
    • Wellcentive, Inc.
      • Company Highlights
      • Product Portfolio
      • Key Highlights
      • Financial Performance
      • Strategies
    • ZeOmega, Inc
      • Company Highlights
      • Product Portfolio
      • Key Highlights
      • Financial Performance
      • Strategies
    • Verscend Technologies, Inc.
      • Company Highlights
      • Product Portfolio
      • Key Highlights
      • Financial Performance
      • Strategies
    • PreciseDx
      • Company Highlights
      • Product Portfolio
      • Key Highlights
      • Financial Performance
      • Strategies
    • CitiusTech Inc
      • Company Highlights
      • Product Portfolio
      • Key Highlights
      • Financial Performance
      • Strategies
    • Avero Diagnostics
      • Company Highlights
      • Product Portfolio
      • Key Highlights
      • Financial Performance
      • Strategies
    • Lightbeam Health Solutions
      • Company Highlights
      • Product Portfolio
      • Key Highlights
      • Financial Performance
      • Strategies
    • LexisNexis Risk Solutions
      • Company Highlights
      • Product Portfolio
      • Key Highlights
      • Financial Performance
      • Strategies
    • Milliman, Inc.
      • Company Highlights
      • Product Portfolio
      • Key Highlights
      • Financial Performance
      • Strategies
    • NVision Health
      • Company Highlights
      • Product Portfolio
      • Key Highlights
      • Financial Performance
      • Strategies
    • RLDatix
      • Company Highlights
      • Product Portfolio
      • Key Highlights
      • Financial Performance
      • Strategies
    • Verisk Analytics, Inc.
      • Company Highlights
      • Product Portfolio
      • Key Highlights
      • Financial Performance
      • Strategies
    • Analyst Views
  12. Section
    • Research Methodology
    • About us

*Browse 52 market data tables and 41 figures on “Patient Risk Stratification Market” - Global forecast to 2030

全球患者风险分级市场 细分

  • 按构成部分
    • 软件
    • 服务
  • 按交付模式
    • 现场
    • 基于云
  • 按类型
    • 预测风险等级 型号
    • 追溯风险分级 型号
    • 预测风险等级 型号
    • 风险等级 型号
  • 通过应用程序
    • 人口健康管理
    • 风险调整
    • 收入周期管理
    • 临床工作流量
  • 按终端用户
    • 保健提供者
    • 保健付费者
    • 其他终端用户
  • 按地区
    • 北美
    • 拉丁美洲
    • 欧洲
    • 亚太
    • 中东
    • 非洲
pie-chart.png

您想要了解购买选项吗?本报告的各个部分?

常见问题 :

阻碍患者风险分层市场增长的关键因素是什么?

数据隐私和安全问题、高前期成本和互操作性问题是妨碍病人风险分层市场增长的一些关键因素。

推动患者风险分层市场增长的主要因素是什么?

患者风险分层市场的主要部分是什么?

在患者风险分层市场运营的主要角色是哪些?

哪个地区将领导患者风险分层市场?

病人风险分层市场的CAGR是什么?