Produced Water Treatment Market Size - Analysis
The produced water treatment market is estimated to be valued at USD 9.53 Bn in 2025 and is expected to reach USD 16.33 Bn by 2032, growing at a compound annual growth rate (CAGR) of 8.00% from 2025 to 2032. The produced water treatment market is expected to be driven by stringent government regulations regarding produced water discharge into the environment.
Market Size in USD Bn
CAGR8.00%
| Study Period | 2025-2032 |
| Base Year of Estimation | 2024 |
| CAGR | 8.00% |
| Market Concentration | Medium |
| Major Players | S.C. Johnson & Son, Godrej Consumer Products Ltd., Dabur India Ltd., Reckitt Benckiser, Spectrum Brands Holdings Inc. and Among Others |
please let us know !
Produced Water Treatment Market Trends
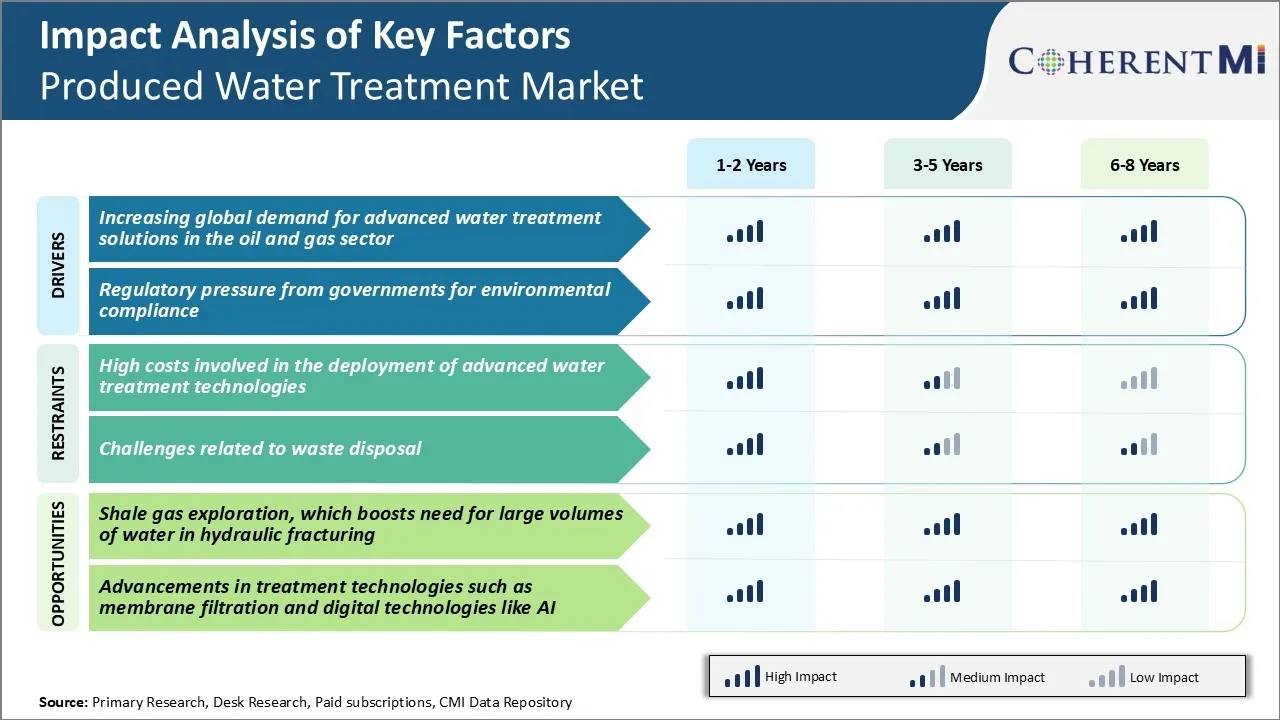
Market Driver - Increasing Global Demand for Advanced Water Treatment Solutions in the Oil and Gas Sector
The global oil and gas industry has been facing challenges posed by large volumes of produced water generation during hydrocarbon extraction processes. As oilfields around the world near depletion, operators are relying more on unconventional resources like shale oil and gas that generate extremely high quantities of contaminated water.
According to estimates, over 21 billion barrels of produced water is disposed as waste each year by the oil and gas industry. Such massive volumes have detrimental impacts on the environment if not handled properly.
At the same time, availability of water is becoming a major issue for drilling and hydraulic fracturing activities in many arid regions. This has heightened the importance of recycling and reuse of produced water within oilfield operations.
Membrane bioreactors, media filtration, reverse osmosis, thermal evaporators, and disinfection processes are now commonly employed. Companies in the produced water treatment market are also investing in digitalization to optimize treatment process and energy recovery. This is expected to drive market growth in the coming years.
Market Driver - Regulatory Pressure from Governments for Environmental Compliance
Governments across the world are tightening regulations related to management and discharge of oilfield wastewater due to rising public scrutiny on environmental performance of petroleum industry. Even underground injection into disposal wells is facing opposition over induced seismicity fears. Ever more stringent discharge standards are being established with stricter limits on chemical oxygen demand, toxicity, chlorides, and other impurities.
Non-compliance can now result in heavy penalties and temporary halts or bans on drilling activities. Producers are finding it difficult to rely only on underground injection infrastructure that is reaching capacity limits in many locations.
Regular audits and monitoring under regulatory scanner are driving investment in online instrumentation, automated process control as well as advanced wastewater characterization. Producers must also systematically handle issues around treatment sludge handling and disposal, which will drive growth of the produced water treatment market.
Policy makers today, emphasize reuse targets and sustainability goals. Thereby, oil companies have to significantly upgrade produced water treatment capabilities through harnessing latest treatment solutions and working with stringent environmental, health, and safety guidelines.

Market Challenge - High Costs Involved in the Deployment of Advanced Water Treatment Technologies
One of the major challenges faced in the produced water treatment market is the high costs involved in deploying advanced water treatment technologies at scale. Implementing produced water treatment systems that can remove dispersed oil, suspended solids, dissolved solids and other contaminants from produced water is an expensive endeavor.
Moreover, the logistical challenges of setting up extensive treatment infrastructure at remote production sites also translates to higher costs. While reuse and recycling of produced water helps reduce freshwater usage and disposal volumes to some extent, the costs of advanced treatment often outweigh these benefits for operators.
Tight capital budgets in the current low oil price environment further disincentivize investments in setting up large-scale, capital intensive water treatment facilities. This cost impediment remains a major roadblock in the produced water treatment market.
Market Opportunity - Shale Gas Exploration, which Boosts Need for Large Volumes of Water in Hydraulic Fracturing
One key opportunity area for the produced water treatment market is the rising shale gas exploration activities worldwide. Hydraulic fracturing techniques have enabled commercial production from shale reservoirs, boosting natural gas supplies.
However, shale gas extraction requires massive volumes of water to pump sand and chemicals deep underground to fracture shale formations and release trapped gas. This surging demand for water in unconventional drilling has led to increased generation of produced water.
This presents promising opportunities for companies in the produced water treatment market offering fit-for-purpose water treatment solutions tailored for the shale gas industry. Developing technologies that allow for cost-effective treatment and reuse of produced water at shale well sites will be key to sustainably address these rising produced water treatment needs.
Key winning strategies adopted by key players of Produced Water Treatment Market
Strategic acquisitions and partnerships: In 2021, Halliburton acquired NexTier's produced water treatment business, strengthening its chemistry and midstream capabilities. Similarly, Schlumberger acquired Twister BV to enhance its solid/liquid separation portfolio for produced water.
Launch of new/advanced technologies: Developing and deploying newer technologies has given competitive edge. Nuverra launched the Helix produced water treatment system in 2019 which treats and recovers up to 98% of water through a compact modular system.
Expanding into sustainable applications: Complying with stringent regulations and reducing environmental impact has driven growth. Companies like Severn Trent and Schlumberger have started recycling of treated water for uses like irrigation, dust suppression etc. Baker Hughes launched its H2prO produced water solution in 2020 focusing on beneficial reuse of resources. Such initiatives boosted their sustainability credentials and revenues.
Focus on data analytics and digital solutions: Adopting Industry 4.0 techniques helps achieve higher operating efficiencies. Suez implemented IoT-based monitoring of its water treatment facilities in Saudi Arabia in 2019. Similarly, Halliburton's OSTRA separation technology uses predictive analytics for optimized operations.
Segmental Analysis of Produced Water Treatment Market

Insights, By Technology: Primary Treatment Technology Meets the Need for Effective Treatment
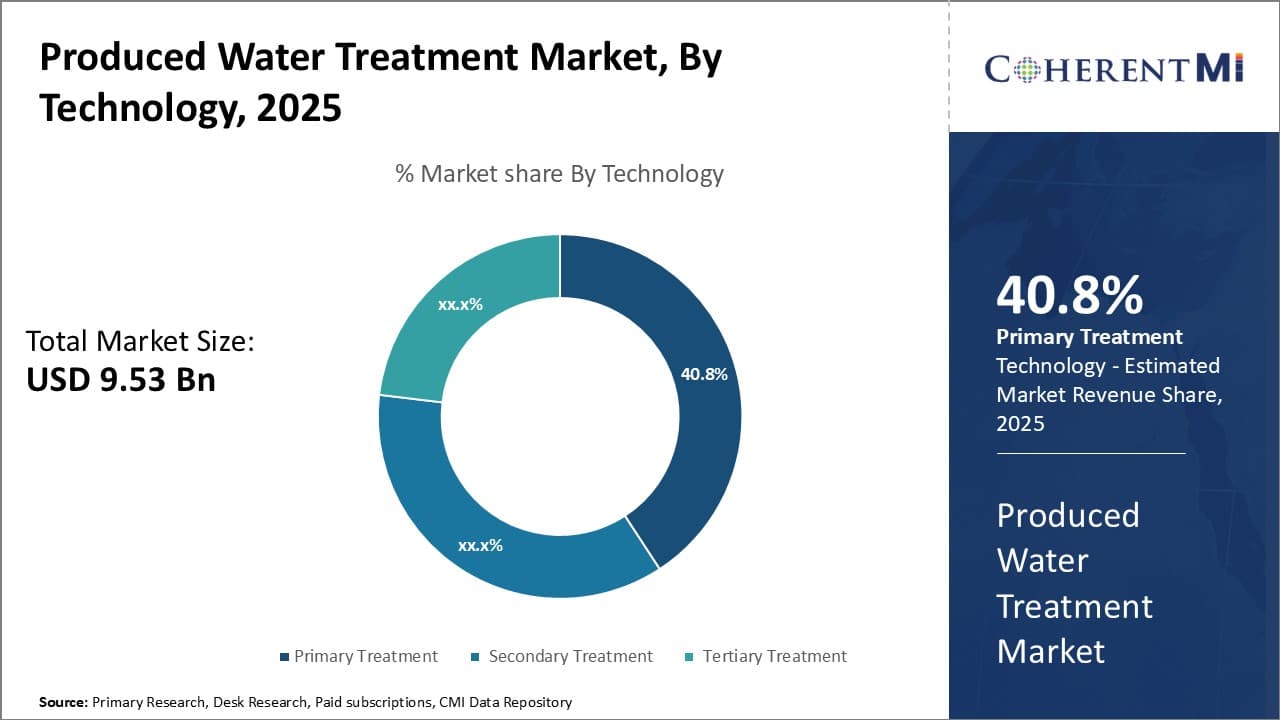
In terms of technology, primary treatment segment is expected to account for 40.8% share of the produced water treatment market in 2025. This is due to its critical function of removing bulk contaminants from produced water before it undergoes further processing.
As one of the first steps in the treatment process, primary treatment technologies such as skimming and coagulation address the large quantities of free oil, grease, and suspended solids present in produced water. Therefore, primary treatment plays an indispensable role in protecting infrastructure integrity and meeting stringent regulatory discharge standards.
Primary treatment technologies in produced water treatment are widely used across all upstream oil and gas operations due to their ability to provide reliable and cost-effective separation of contaminants. As the gateway to further polishing, primary treatment continues to account for the bulk of spending on produced water treatment systems and ensures other downstream technologies can perform as designed.
 Insights, By Application: Maintaining Flow from Land-Based Operations
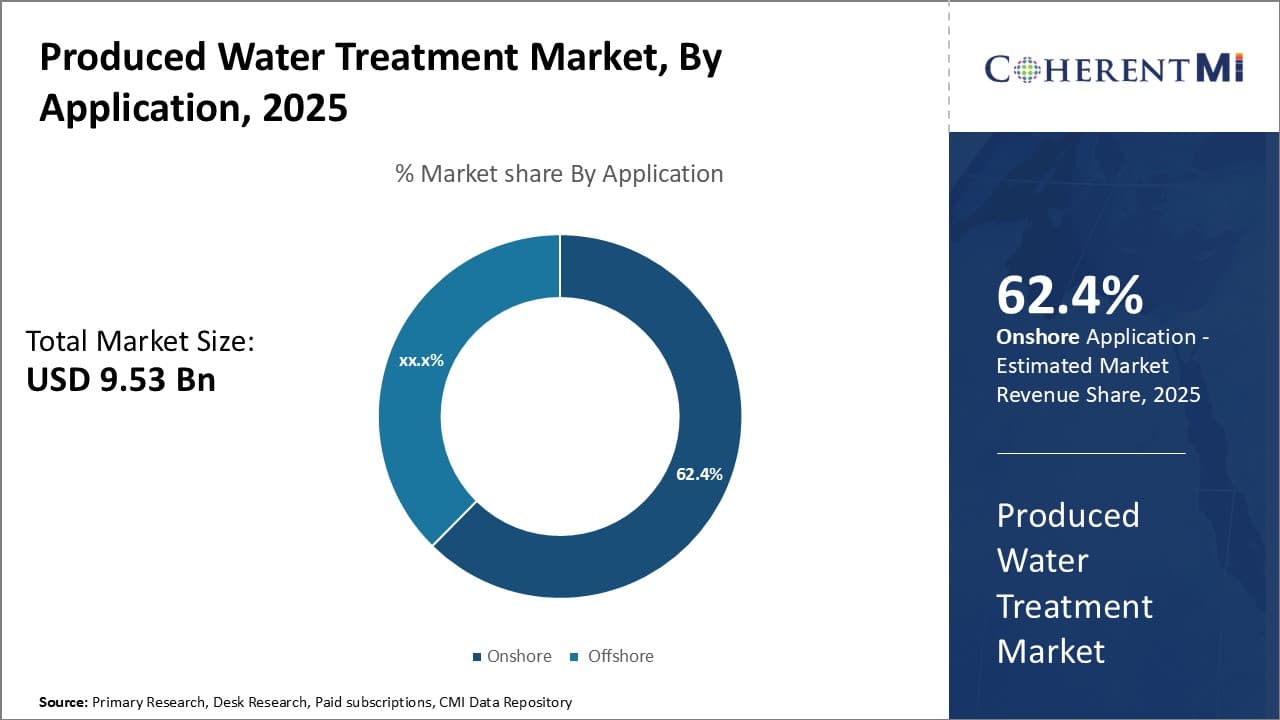
In terms of application, onshore contributes 62.4% share of the produced water treatment market, as the vast majority of oil and gas production still occurs on land. According to estimates, over 90% of global wells and associated infrastructure are based onshore, generating enormous volumes of produced water daily.
Effective onshore treatment is further necessitated by the large land area and decentralized nature of facilities. Pipelines, tank networks, and other logistics require robust systems able to treat varied water qualities on a massive scale with minimal transportation.
Growing environmental oversight also poses unique compliance challenges for terrestrial operations pertaining to land use and subsurface disposal. As such, dependable onshore treatment remains a high priority, underpinning produced water treatment spending even as offshore activity gradually increases.
Insights, By Service: Ensuring Project Compliance and Performance
In terms of service, design contributes the highest share of the produced water treatment market as it establishes the foundation for entire water handling projects. Careful system design is imperative from the outset to identify appropriate treatment objectives, select compliant and fit-for-purpose technologies, properly size equipment, and integrate with associated infrastructure. Design engineers specify modular packages customized for specific water properties and capable of achieving discharge or reinjection goals.
As regulations evolve and projects expand, adaptive re-design remains critical. Therefore, high-quality front-end system design forms the basis for sustained compliance, protecting industry reputation and facilitating continued resource production for decades to come.
Additional Insights of Produced Water Treatment Market
- Onshore Segment Dominance: The onshore application segment holds approximately 62.35% of the produced water treatment market share due to the prevalence of onshore drilling activities globally.
- North America held the largest share of 43% in the produced water treatment market in 2023, with Europe expected to experience the fastest growth.
- Regional Growth: The Asia Pacific region is anticipated to register the highest growth rate in the global produced water treatment market, attributed to escalating oil exploration projects and stricter environmental norms.
- Service Segment Insights: The operation & maintenance subsegment accounts for 45.25% share of the produced water treatment market, highlighting the ongoing need for system upkeep.
- Offshore drilling companies in the produced water treatment market are increasingly adopting mobile treatment units to manage produced water, reducing the need for transportation and disposal.
Competitive overview of Produced Water Treatment Market
The major players operating in the produced water treatment market include S.C. Johnson & Son, Godrej Consumer Products Ltd., Dabur India Ltd., Reckitt Benckiser, Spectrum Brands Holdings Inc., Veolia Environnement S.A., Schlumberger Limited, Siemens AG, Halliburton Company, Baker Hughes Company, SUEZ, Alderley plc, Ovivo Inc., CETCO Energy Services, and Aquatech International LLC.
Produced Water Treatment Market Leaders
- S.C. Johnson & Son
- Godrej Consumer Products Ltd.
- Dabur India Ltd.
- Reckitt Benckiser
- Spectrum Brands Holdings Inc.
Produced Water Treatment Market - Competitive Rivalry

Produced Water Treatment Market
(Dominated by major players)
(Highly competitive with lots of players.)
Recent Developments in Produced Water Treatment Market
- In December 2023, Samyang Corporation introduced two new industrial produced water treatment products—TRILITE RO (Reverse Osmosis) and TRILITE EDI (Electrodeionizer)—as part of its efforts to become a comprehensive water solution company. These products are key in producing ultrapure water for sectors like semiconductors and electronics.
- In September 2023, Schlumberger Limited launched a mobile offshore water treatment unit, enabling on-site treatment and minimizing environmental impact during drilling operations.
- In August 2023, Halliburton Company partnered with a Middle Eastern oil firm to deploy customized, produced water treatment solutions, expanding its footprint in the region.
- In June 2023, Veolia Environnement S.A. introduced an advanced oxidation process enhancing treatment efficiency and reducing costs, strengthening its competitive edge in the produced water treatment market.
- In April 2023, Siemens AG acquired a minority stake in a membrane technology startup, aiming to integrate innovative filtration solutions into its existing produced water treatment systems.
Produced Water Treatment Market Segmentation
- By Technology
- Primary Treatment
- Skimming
- Coagulation
- Secondary Treatment
- Biological Aerated Filters
- Membrane Bioreactors
- Tertiary Treatment
- Advanced Oxidation Processes
- Ion Exchange
- Primary Treatment
- By Application
- Onshore
- Conventional Oil Wells
- Unconventional Oil Wells
- Offshore
- Shallow Water
- Deepwater
- Onshore
- By Service
- Design
- Process Engineering
- System Integration
- Construction
- Equipment Installation
- Infrastructure Development
- Operation & Maintenance
- Design

Would you like to explore the option of buying individual sections of this report?
Sakshi Suryawanshi is a Research Consultant with 6 years of extensive experience in market research and consulting. She is proficient in market estimation, competitive analysis, and patent analysis. Sakshi excels in identifying market trends and evaluating competitive landscapes to provide actionable insights that drive strategic decision-making. Her expertise helps businesses navigate complex market dynamics and achieve their objectives effectively.
Frequently Asked Questions :
How big is the produced water treatment market?
The produced water treatment market is estimated to be valued at USD 9.53 Bn in 2025 and is expected to reach USD 16.33 Bn by 2032.
What are the key factors hampering the growth of the produced water treatment market?
High costs involved in the deployment of advanced water treatment technologies and challenges related to waste disposal are the major factors hampering the growth of the produced water treatment market.
What are the major factors driving the produced water treatment market growth?
Increasing global demand for advanced water treatment solutions in the oil and gas sector and regulatory pressure from governments for environmental compliance are the major factors driving the produced water treatment market.
Which is the leading technology in the produced water treatment market?
The leading technology segment is primary treatment.
Which are the major players operating in the produced water treatment market?
S.C. Johnson & Son, Godrej Consumer Products Ltd., Dabur India Ltd., Reckitt Benckiser, Spectrum Brands Holdings Inc., Veolia Environnement S.A., Schlumberger Limited, Siemens AG, Halliburton Company, Baker Hughes Company, SUEZ, Alderley plc, Ovivo Inc., CETCO Energy Services, and Aquatech International LLC are the major players.
What will be the CAGR of the produced water treatment market?
The CAGR of the produced water treatment market is projected to be 8.00% from 2025-2032.