美国制药公司 市场 规模与份额分析 - 成长趋势与预测 (2023 - 2030)

美国药品市场按产品类型划分(处方药、通用药品、OTC药品、生物类药物、生物类药物)、按治疗区划分(肿瘤、糖尿病、自动免疫疾病、神经疾病、心血管疾病、传染病)、按分配渠道划分(医院药房、零售药房、在线药房)、按管理路线划分(Oral、Prientoral、Topical)、按最终用户划分(医院、诊所、....

美国制药公司 市场 规模

市场规模(美元) Bn

复合年增长率8.6%

研究期2023 - 2030
估计基准年2022
复合年增长率8.6%
最大的市场Northeast
市场集中度High
主要参与者约翰逊和约翰逊公司., 辉瑞股份有限公司., 阿比维公司., 默科克 KGaA, 布里斯托尔迈尔斯·斯基布公司 以及其他
*免责声明:主要参与者的列表没有特定的顺序。
*来源:Coherent Market Insights
setting-icon
想要购买定制报告吗?
请告诉我们!

美国制药公司 市场 分析

美国制药公司 市场规模预计将达到 到2030年,从2023年的5,994.7亿美元增加到10,680.2亿美元,CAGR为8.6% 在预测期间。

药品是指用于诊断,治疗,治疗,缓解,或预防人类或动物疾病的处方和场外药物. 市场受到慢性病发病率上升、新药物喷发和保健开支增加的驱动。

美国制药公司 市场按产品类型、治疗区、分销渠道、管理路线和最终用户划分。 按产品类型划分,市场分为处方药,非专利药,OTC药,生物类,生物类. 处方药部分占2022年的最大份额,原因是新的药物发布和慢性疾病的发病率上升。

美国制药公司 市场驱动器 :

  • 慢性病发病率增加: 癌症、心血管疾病、糖尿病等慢性病发病率上升,是推动美国药品市场增长的主要因素。 由于定居的生活方式、不健康的饮食、更大的压力和老龄化,患有慢性病的人口正在稳步增长。 持续使用药品管理慢性病. 新的药物开发的重点是解决慢性病治疗方面未得到满足的需要。 例如,据国家生物技术信息中心称,在2021年COVID-19期间,主要报告了胸膜炎的发病情况。 根据世界海思联合会的报告,在2021年,全球有10亿人在2020年患了胸腺炎.
  • 有利的监管和偿还设想: 美国食品药品管理局提供的监管框架有助于加快对新药和患者疗法的审查和批准。 快轨,突破治疗,加快审批等举措,重点审查指定加快重症药品研制和审查. 此外,根据《医疗保险计划》D部分、《医疗补助》和私人保险人,报销政策为大多数处方药费用提供了保险。 这为药品提供了可获取性和可负担性。 据美国食品药品管理局(USFDA)称,任何基于上述标签说明和警告的安全和有效供消费者直接使用的药物,都被认为超过柜台或非处方药物. 对OTC药物有两种管理途径,可以获得USFDA的批准,其中包括OTC新药物应用(NDA)和OTC药物专论. 需要为东方木材公司的产品制定安全和效能标准、良好制造做法(检查)和低于21 CFR 201.66的标签。

美国制药公司 市场机会:

  • 越来越多地采用个性化药物: 基因组学、生物标记和伴生诊断方面的进展,使患者能够根据其基因组成和分子特征,获得更有针对性的治疗。 个性化的药物可以帮助避免试药和过量处方,并通过适合个人的最佳治疗来改善结果。 精密肿瘤学是这一机会的前列。
  • 对细胞和基因治疗的需求增加: 细胞和基因疗法通过改变身体自身的细胞或引入健康的基因,为治疗罕见的遗传紊乱和癌症提供了巨大的潜力。 中非共和国 已经批准了血癌的T细胞疗法。 大量投资和研发的重点是下一代细胞和基因疗法,以治疗广泛的疾病。 他们的变革潜力提供了一个大机会。

美国制药公司 市场限制:

  • 药物滥用的发生率: 由于监管当局缺乏严格的条例和执法措施,预计美国的场外毒品市场将受阻。 预计这将限制市场在预测期间的增长。 例如,根据DrugAbuse.gov:2020,约有310万12至25岁的年轻人使用非处方性咳嗽和冷药进行高血压。 此外,在美国,2020年,约有210万次与药物滥用有关的医院访问,其中27.1%涉及非医疗使用药物(OTC药物)。 此外,据美国国家药物滥用研究所(National Institute on Drug Experience)称,2018年,约有3.4%的高中高年级学生曾滥用咳嗽药. 因此,预计药物滥用的高度概率将阻碍市场在预测期间的增长。

美国制药公司 市场 趋势

  • OTC药物的流行程度不断提高: 近年来,在保健消费、自药和提供Rx至OTC开关的驱动下,OTC药物市场出现了大幅增长。 更多地获得关于副作用的信息和认识,正在推动采用OTC药物。 提供OTC药物可以改善病人的获得,同时减轻保健系统的压力。 从Rx到OTC的切换是指将经证明的处方药转移到非处方药. 由于开关,许多人可以在不咨询医生的情况下方便地购买和使用范围更广的镇痛药,抗西夏胺药,减少心脏灼伤剂,尼古丁替代产品和咳嗽,感冒和流感产品. 例如,在2020年,美国食品和药物管理局(美国FDA)将葛兰素史克琳的Voltaren 关节炎疼痛(Diclofenac 钠局部凝胶,1%),阿尔康的Pataday Daily Relief(olopatanine HCl眼膜溶液/滴液,0.1%)和Once Daily Relief(olopatanine HCl眼膜溶液/滴液,0.2%)转化为OTC药物.

美国制药公司 市场区域透视:

  • 东北: 东北地区是美国最大的医药市场,市场份额超过40%. 该地区是美国一些最大和最富裕的城市以及一些主要制药公司的所在地。
  • 西边: 西部地区是美国第二大医药市场,市场份额超过30%. 该地区是一些大型和不断发展的城市以及一些生物技术公司的所在地。
  • 南边: 南部地区是美国第三大医药市场,市场份额超过15%. 该区域是一些大型和不断发展的城市以及一些制药公司的所在地。
  • 中西部地区: 中西部地区是美国最小的医药市场,市场份额不到15%. 该地区拥有一些大型和不断发展的城市,但也有一些农村地区。

图 1. 美国医药市场价值(Bn美元),2023年
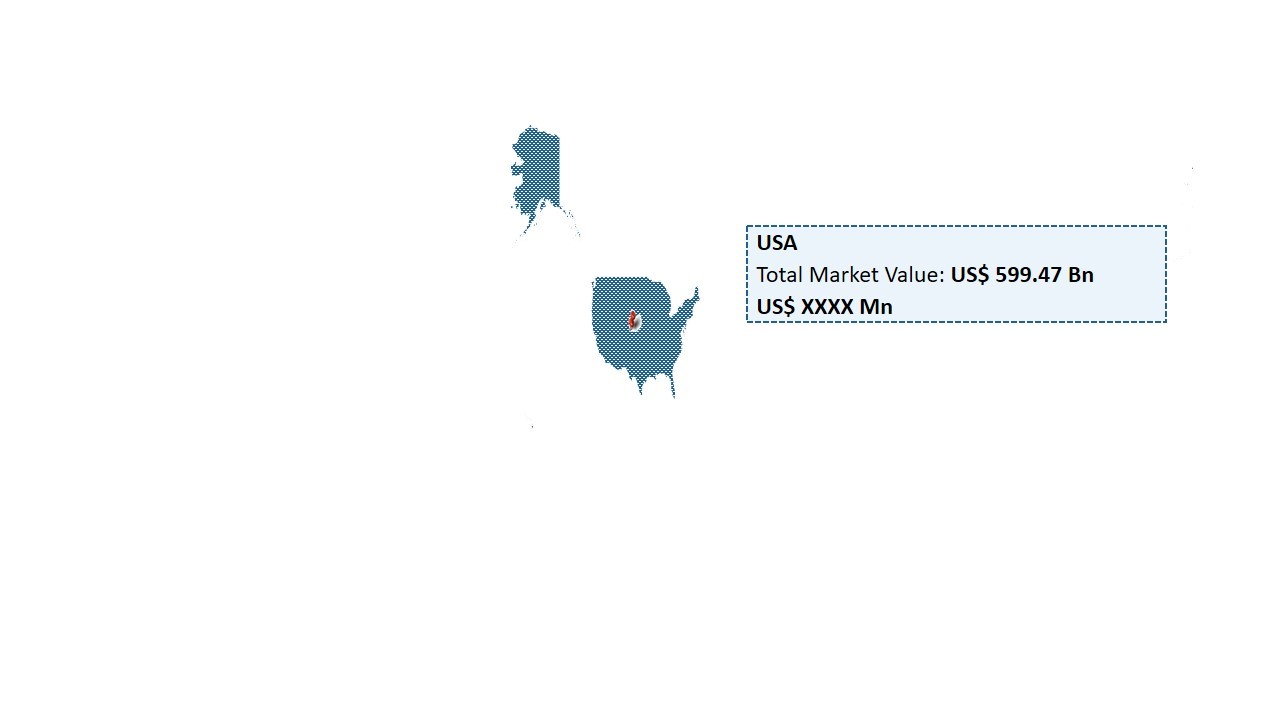
美国制药公司 市场

竞争概览 美国制药公司 市场

在美国制药市场经营的主要玩家包括约翰逊和约翰逊公司、辉瑞公司、AbbVie公司、Merck KGaA、布里斯托尔-迈尔斯·斯基布公司、Amgen公司、Eli Lilly and Company、Novartis AG、Gilead Sciences、F. Hoffmann-La Roche Ltd、Sanofi、AstraZeneca、GSK plc、Bayer AG、Boehringer Ingelheim International GmbH、Teva制药工业有限公司、Abbott和Biogen。

美国制药公司 市场 领导者

  • 约翰逊和约翰逊公司.
  • 辉瑞股份有限公司.
  • 阿比维公司.
  • 默科克 KGaA
  • 布里斯托尔迈尔斯·斯基布公司
*免责声明:主要参与者的列表没有特定的顺序。

美国制药公司 市场 - 竞争对手

Market Concentration Graph

美国制药公司 市场

市场整合
(主要参与者主导)
市场分散
(竞争激烈,参与者众多。)
*来源:Coherent Market Insights

最新发展 美国制药公司 市场

新产品发射:

  • 2020年7月,任,. 诺华集团一家制药公司从桑多兹分公司推出了15种非专利药品和OTC药品,以治疗COVID-19患者。 OTC产品包括治疗肠胃病,急性呼吸道症状,肺炎以及化粪池休克.
  • 2020年3月,美国食品药品管理局(FDA)批准了GlaxoSmithKline的Advil Duble Action,这是第一款结合ibuprofen和acetaminophen的OTC配方,用于缓解疼痛.

采购和伙伴关系:

  • 2022年8月,诺华AG公司,制药公司将桑多兹公司,其非专利和生物类同公司拆分为一家新的公开交易的独立公司,通过100%的附带收益. 独立的桑多兹公司除了总部设在瑞士并在瑞士交易所上市之外,还将有一个美国保存收据方案。
  • 2022年10月08日,,阳县城. (原始内容存档于2017-09-29). GlaxoSmithKline Plc.制药和生物技术公司宣布了与Tempus的三项合作协定、临床和分子数据图书馆以及一个操作系统。 合作协定将允许加快临床试验的步伐,这将有助于在市场上推出更多的产品,包括东方木材公司的产品。

美国制药公司 市场 报告 - 目录

Table of Contents

  1. Research Objectives and Assumptions
    • Research Objectives
    • Assumptions
    • Abbreviations
  2. Market Purview
    • Report Description
      • Market Definition and Scope
    • Executive Summary
      • Market United States Pharmaceuticals, By Product Type
      • Market United States Pharmaceuticals, By Therapy Area
      • Market United States Pharmaceuticals, By Distribution Channel
      • Market United States Pharmaceuticals, By Route of Administration
      • Market United States Pharmaceuticals, By End User
      • Market United States Pharmaceuticals, By Region
    • Coherent Opportunity Map (COM)
  3. Market Dynamics, Regulations, and Trends Analysis
    • Market Dynamics
      • Rising prevalence of chronic diseases
    • Impact Analysis
    • Key Highlights
    • Regulatory Scenario
    • Product launch/Approvals
    • PEST Analysis
    • PORTER’s Analysis
    • Merger and Acquisition Scenario
  4. United States Pharmaceuticals Market – Impact of Coronavirus (COVID-19) Pandemic
    • COVID-19 Epidemiology
    • Supply Side and Demand Side Analysis
    • Economic Impact
  5. United States Pharmaceuticals Market , By Product Type, 2023-2030, (US$ Bn)
    • Introduction
      • Market Share Analysis, 2023 and 2030 (%)
      • Y-o-Y Growth Analysis, 2018 – 2030
      • Segment Trends
    • Prescription Drugs
      • Introduction
      • Market Size and Forecast, and Y-o-Y Growth, 2023-2030,(US$ Bn)
    • Generic Drugs
      • Introduction
      • Market Size and Forecast, and Y-o-Y Growth, 2023-2030,(US$ Bn)
    • OTC Drugs
      • Introduction
      • Market Size and Forecast, and Y-o-Y Growth, 2023-2030,(US$ Bn)
    • Biologics
      • Introduction
      • Market Size and Forecast, and Y-o-Y Growth, 2023-2030,(US$ Bn)
    • Biosimilars
      • Introduction
      • Market Size and Forecast, and Y-o-Y Growth, 2023-2030,(US$ Bn)
  6. United States Pharmaceuticals Market , By Therapy Area, 2023-2030, (US$ Bn)
    • Introduction
      • Market Share Analysis, 2023 and 2030 (%)
      • Y-o-Y Growth Analysis, 2018 – 2030
      • Segment Trends
    • Oncology
      • Introduction
      • Market Size and Forecast, and Y-o-Y Growth, 2023-2030,(US$ Billion)
    • Diabetes
      • Introduction
      • Market Size and Forecast, and Y-o-Y Growth, 2023-2030,(US$ Billion)
    • Autoimmune Diseases
      • Introduction
      • Market Size and Forecast, and Y-o-Y Growth, 2023-2030,(US$ Billion)
    • Neurological Disorders
      • Introduction
      • Market Size and Forecast, and Y-o-Y Growth, 2023-2030,(US$ Billion)
    • Cardiovascular
      • Introduction
      • Market Size and Forecast, and Y-o-Y Growth, 2023-2030,(US$ Billion)
    • Infectious Diseases
      • Introduction
      • Market Size and Forecast, and Y-o-Y Growth, 2023-2030,(US$ Billion)
    • Others (Respiratory, Gastrointestinal, etc.)
      • Introduction
      • Market Size and Forecast, and Y-o-Y Growth, 2023-2030,(US$ Billion)
  7. United States Pharmaceuticals Market , By Distribution Channel, 2023-2030, (US$ Bn)
    • Introduction
      • Market Share Analysis, 2023 and 2030 (%)
      • Y-o-Y Growth Analysis, 2018 – 2030
      • Segment Trends
    • Hospital Pharmacies
      • Introduction
      • Market Size and Forecast, and Y-o-Y Growth, 2023-2030,(US$ Billion)
    • Retail Pharmacies
      • Introduction
      • Market Size and Forecast, and Y-o-Y Growth, 2023-2030,(US$ Billion)
    • Online Pharmacies
      • Introduction
      • Market Size and Forecast, and Y-o-Y Growth, 2023-2030,(US$ Billion)
    • Others
      • Introduction
      • Market Size and Forecast, and Y-o-Y Growth, 2023-2030,(US$ Billion)
  8. United States Pharmaceuticals Market , By Route of Administration, 2023-2030, (US$ Bn)
    • Introduction
      • Market Share Analysis, 2023 and 2030 (%)
      • Y-o-Y Growth Analysis, 2018 – 2030
      • Segment Trends
    • Oral
      • Introduction
      • Market Size and Forecast, and Y-o-Y Growth, 2023-2030,(US$ Billion)
    • Parenteral
      • Introduction
      • Market Size and Forecast, and Y-o-Y Growth, 2023-2030,(US$ Billion)
    • Topical
      • Introduction
      • Market Size and Forecast, and Y-o-Y Growth, 2023-2030,(US$ Billion)
    • Others
      • Introduction
      • Market Size and Forecast, and Y-o-Y Growth, 2023-2030,(US$ Billion)
  9. United States Pharmaceuticals Market , By End User, 2023-2030, (US$ Bn)
    • Introduction
      • Market Share Analysis, 2023 and 2030 (%)
      • Y-o-Y Growth Analysis, 2018 – 2030
      • Segment Trends
    • Hospitals
      • Introduction
      • Market Size and Forecast, and Y-o-Y Growth, 2023-2030,(US$ Billion)
    • Clinics
      • Introduction
      • Market Size and Forecast, and Y-o-Y Growth, 2023-2030,(US$ Billion)
    • Homecare
      • Introduction
      • Market Size and Forecast, and Y-o-Y Growth, 2023-2030,(US$ Billion)
    • Others
      • Introduction
      • Market Size and Forecast, and Y-o-Y Growth, 2023-2030,(US$ Billion)
  10. United States Pharmaceuticals Market , By Region, 2023-2030, (US$ Bn)
    • Introduction
      • Market Share Analysis, 2023 and 2030 (%)
      • Y-o-Y Growth Analysis, 2018 - 2030
      • Regional Trends
    • North East
      • Introduction
      • Market Size and Forecast, and Y-o-Y Growth, By Product Type, 2018-2030,(US$ Bn)
      • Market Size and Forecast, and Y-o-Y Growth, By Therapy Area, 2018-2030,(US$ Bn)
      • Market Size and Forecast, and Y-o-Y Growth, By Distribution Channel, 2018-2030,(US$ Bn)
      • Market Size and Forecast, and Y-o-Y Growth, By Route of Administration, 2018-2030,(US$ Bn)
      • Market Size and Forecast, and Y-o-Y Growth, By End User, 2018-2030,(US$ Bn)
    • West
      • Introduction
      • Market Size and Forecast, and Y-o-Y Growth, By Product Type, 2018-2030,(US$ Bn)
      • Market Size and Forecast, and Y-o-Y Growth, By Therapy Area, 2018-2030,(US$ Bn)
      • Market Size and Forecast, and Y-o-Y Growth, By Distribution Channel, 2018-2030,(US$ Bn)
      • Market Size and Forecast, and Y-o-Y Growth, By Route of Administration, 2018-2030,(US$ Bn)
      • Market Size and Forecast, and Y-o-Y Growth, By End User, 2018-2030,(US$ Bn)
    • South
      • Introduction
      • Market Size and Forecast, and Y-o-Y Growth, By Product Type, 2018-2030,(US$ Bn)
      • Market Size and Forecast, and Y-o-Y Growth, By Therapy Area, 2018-2030,(US$ Bn)
      • Market Size and Forecast, and Y-o-Y Growth, By Distribution Channel, 2018-2030,(US$ Bn)
      • Market Size and Forecast, and Y-o-Y Growth, By Route of Administration, 2018-2030,(US$ Bn)
      • Market Size and Forecast, and Y-o-Y Growth, By End User, 2018-2030,(US$ Bn)
    • Midwest
      • Introduction
      • Market Size and Forecast, and Y-o-Y Growth, By Product Type, 2018-2030,(US$ Bn)
      • Market Size and Forecast, and Y-o-Y Growth, By Therapy Area, 2018-2030,(US$ Bn)
      • Market Size and Forecast, and Y-o-Y Growth, By Distribution Channel, 2018-2030,(US$ Bn)
      • Market Size and Forecast, and Y-o-Y Growth, By Route of Administration, 2018-2030,(US$ Bn)
      • Market Size and Forecast, and Y-o-Y Growth, By End User, 2018-2030,(US$ Bn)
  11. Competitive Landscape
    • Johnson and Johnson Inc.
      • Company Highlights
      • Product Portfolio
      • Key Developments
      • Financial Performance
      • Strategies
    • Pfizer Inc.
      • Company Highlights
      • Product Portfolio
      • Key Highlights
      • Financial Performance
      • Strategies
    • AbbVie Inc.
      • Company Highlights
      • Product Portfolio
      • Key Highlights
      • Financial Performance
      • Strategies
    • Merck KGaA
      • Company Highlights
      • Product Portfolio
      • Key Highlights
      • Financial Performance
      • Strategies
    • Bristol-Myers Squibb Company
      • Company Highlights
      • Product Portfolio
      • Key Highlights
      • Financial Performance
      • Strategies
    • Amgen Inc.
      • Company Highlights
      • Product Portfolio
      • Key Highlights
      • Financial Performance
      • Strategies
    • Eli Lilly and Company
      • Company Highlights
      • Product Portfolio
      • Key Highlights
      • Financial Performance
      • Strategies
    • Novartis AG
      • Company Highlights
      • Product Portfolio
      • Key Highlights
      • Financial Performance
      • Strategies
    • F.Hoffmann-La Roche Ltd
      • Company Highlights
      • Product Portfolio
      • Key Highlights
      • Financial Performance
      • Strategies
    • Sanofi
      • Company Highlights
      • Product Portfolio
      • Key Highlights
      • Financial Performance
      • Strategies
    • AstraZeneca
      • Company Highlights
      • Product Portfolio
      • Key Highlights
      • Financial Performance
      • Strategies
    • GSK plc.
      • Company Highlights
      • Product Portfolio
      • Key Highlights
      • Financial Performance
      • Strategies
    • Bayer AG
      • Company Highlights
      • Product Portfolio
      • Key Highlights
      • Financial Performance
      • Strategies
    • Boehringer Ingelheim International GmbH
      • Company Highlights
      • Product Portfolio
      • Key Highlights
      • Financial Performance
      • Strategies
    • Teva Pharmaceutical Industries Ltd.
      • Company Highlights
      • Product Portfolio
      • Key Highlights
      • Financial Performance
      • Strategies
    • Abbott
      • Company Highlights
      • Product Portfolio
      • Key Highlights
      • Financial Performance
      • Strategies
    • Biogen
      • Company Highlights
      • Product Portfolio
      • Key Highlights
      • Financial Performance
      • Strategies
    • Analyst Views
  12. Section
    • Research Methodology
    • About us

*Browse 37 market data tables and 46 figures on “United States Pharmaceuticals Market” - Global forecast to 2030

美国制药公司 市场 细分

  • 按产品类型
    • 处方药
    • 普通药物
    • OTC 东方木材公司 毒品
    • 生物学
    • 生物类似物
  • 按治疗区
    • 肿瘤
    • 糖尿病
    • 自动免疫疾病
    • 神经疾病
    • 心血管
    • 传染病
    • 其他(呼吸、胃肠等)
  • 按分发频道
    • 医院药房
    • 零售药店
    • 在线药店
    • 其他人员
  • 按行政路线分列
    • 口头
    • 家长
    • 专题
    • 其他人员
  • 按最终用户
    • 医院
    • 诊所
    • 家庭护理
    • 其他人员
  • 按地域划分
    • 东北
    • 西部
    • 南方
    • 中西部地区
pie-chart.png

您想要了解购买选项吗?本报告的各个部分?

常见问题 :

阻碍美国医药市场增长的关键因素是什么?

定价压力,专利到期,严格监管,产品开发周期长,临床试验故障率高.

驱动美国医药市场增长的主要因素是什么?

美国药品市场的主要部分是什么?

在美国制药市场运营的主要角色是哪些?

哪个地区将领导美国制药市场?

美国制药市场的CAGR是什么?